Logging in CUBA Applications
In order to get insights into a running CUBA application, Logging is one crucial part to get in place. The Java ecosystem has very mature mechanisms to do application logging. This guide shows how this ecosystem can be leveraged in a CUBA application.
What we are going to build
This guides enhances the CUBA petclinic example to show how logging can be integrated, configured and viewed as part of the application itself or with the help of external tools.
Requirements
Your development environment requires to contain the following:
-
CUBA Studio as standalone IDE or as an IntelliJ IDEA plugin
Download and unzip the source repository for this guide, or clone it using git:
Example: CUBA petclinic
The project that is the basis for this example is CUBA Petclinic. It is based on the commonly known Spring Petclinic. The CUBA Petclinic application deals with the domain of a Pet clinic and the associated business workflows to manage a pet clinic.
The underlying domain model for the application looks like this:
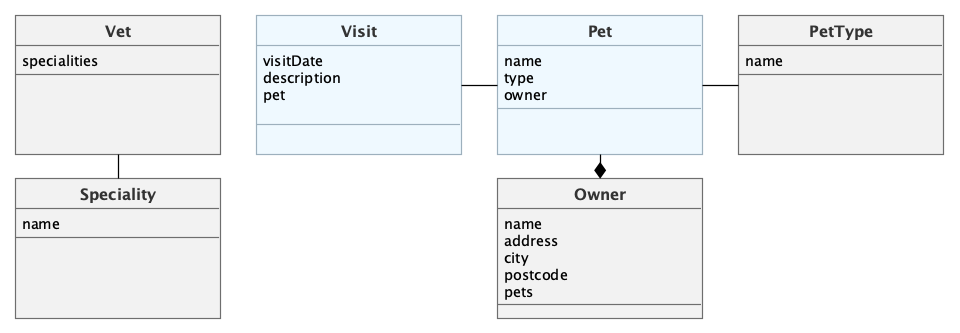
The main entities are Pet and Visit. A Pet is visiting the petclinic and during this Visit a Vet is taking care of it. A Pet belongs to an Owner, which can hold multiple pets. The visit describes the act of a pet visiting the clinic with the help of its owner.
Why Application Logging is Essential
Logging information about the running application is essential in order to get insights on how the application behaves, what unexpected behavior occurs and how the users are interacting with the system.
Logging is a common tool of application development and operation. The developer writes statements into the application source code indicating that certain actions happened.
In the following example two possible log messages are written. In case of successful storage of the Pet instance, an info message is logged with the details of the pet, which has been stored. In case of a failure of storing the Pet, an error message is logged with information about the failure.
private Pet savePet(Pet pet) {
    try {
        Pet savedPet = dataManager.commit(pet);
        log.info("Pet " + pet + " was saved correctly");
        return savedPet;
    } catch (Exception e) {
        log.error("Pet " + pet + " could not be saved", e);
        return null;
    }
}
Those messages will be written in a configured place that some administrator or developer has access to for later use. Normally, this place is a plain text file, but it is also possible to store the logging information in a Database or a centralized logging service.
While the application is developed there is a possibility to debug the source code. This gives a developer the ability to stop the application at any point of time and reason about its internal state.
For a running application, this is normally not the case. Either because of security reasons or simply because the application is not run on a server that is under the control of a developer.
Therefore logging is another tool in the toolbox of a developer in order to do diagnostics of a running application.
The Java Logging Ecosystem
In the Java ecosystem logging has (as in a lot of other ecosystems as well) played a substantial role. There are various mechanisms and abstractions out there on how to actually interact with the logging mechanisms of the platform the application is running on.
Mainly these are various APIs of the JVM and different logging libraries that encapsulate the technical concern of logging to a file / database from the abstraction of "writing a log message".
In recent years a commonly used combination has been adopted in the Java ecosystem:
-
Slf4J
-
Logback
Slf4J is an abstract API that encapsulates the concrete details of the logging library. It offers different methods for logging information to the logging system with different servity levels (DEBUG, INFO, WARN etc.).
Logback, on the other hand, is the logging library that fulfills this API and does the heavy lifting of writing the message to a log appender. An appender is a component within the logging library that takes a logging event created by an application developer and writes it to a specific output. Logback contains the options to configure how the logging system should behave, which log information go into which appender etc.
How to Log in a CUBA Application
The usage of logging libraries within a CUBA application does not differ from other Java applications in this regard. CUBA is by default configured with Sl4fJ and Logback in place. The framework itself uses them for framework internal logging messages.
In order to log information within a class, an instance of a Logger has to be created in the class that wants to log information.
@Service(DiseaseWarningMailingService.NAME)
public class DiseaseWarningMailingServiceBean implements DiseaseWarningMailingService {

    private static final Logger log = LoggerFactory.getLogger(DiseaseWarningMailingServiceBean.class); (1)

    // ...

    @Override
    public int warnAboutDisease(PetType petType, String disease, String city) {

        log.debug("Disease warnings should be send out for Pet type: {}, Disease: {} in the area of {}", petType, disease, city); (2)

        List<Pet> petsInDiseaseCity = findPetsInDiseaseCity(petType, city);
        List<Pet> petsWithEmail = filterPetsWithValidOwnersEmail(petsInDiseaseCity);

        log.debug("possible pets in danger: {}", petsWithEmail);

        petsWithEmail.forEach(pet -> sendEmailToPetsOwner(pet, disease, city));
        int amountOfInformedPets = petsWithEmail.size();

        log.info("Summary: Disease warning send out to {} Pet(s) in {}", amountOfInformedPets, city); (3)

        return amountOfInformedPets;
    }

    // ...
}| 1 | Logger configured for this class is defined through Slf4J |
| 2 | Write debug log message when warnAboutDisease is initiated |
| 3 | Write summary info message about the outcome of the method execution. Variable parts of the log message can be passed into the method as parameters and marked in the log message as the following placeholder: {} |
View Log Messages Through CUBA UI
There are several ways to get access to the log output of the running application. The most common way is a log file within the filesystem of the server. Unfortunately, this oftentimes requires special permissions and knowledge to get access to the file.
CUBA offers a user interface screen, which displays the log information of the running application. It can be found via Administration > Server Log > View:
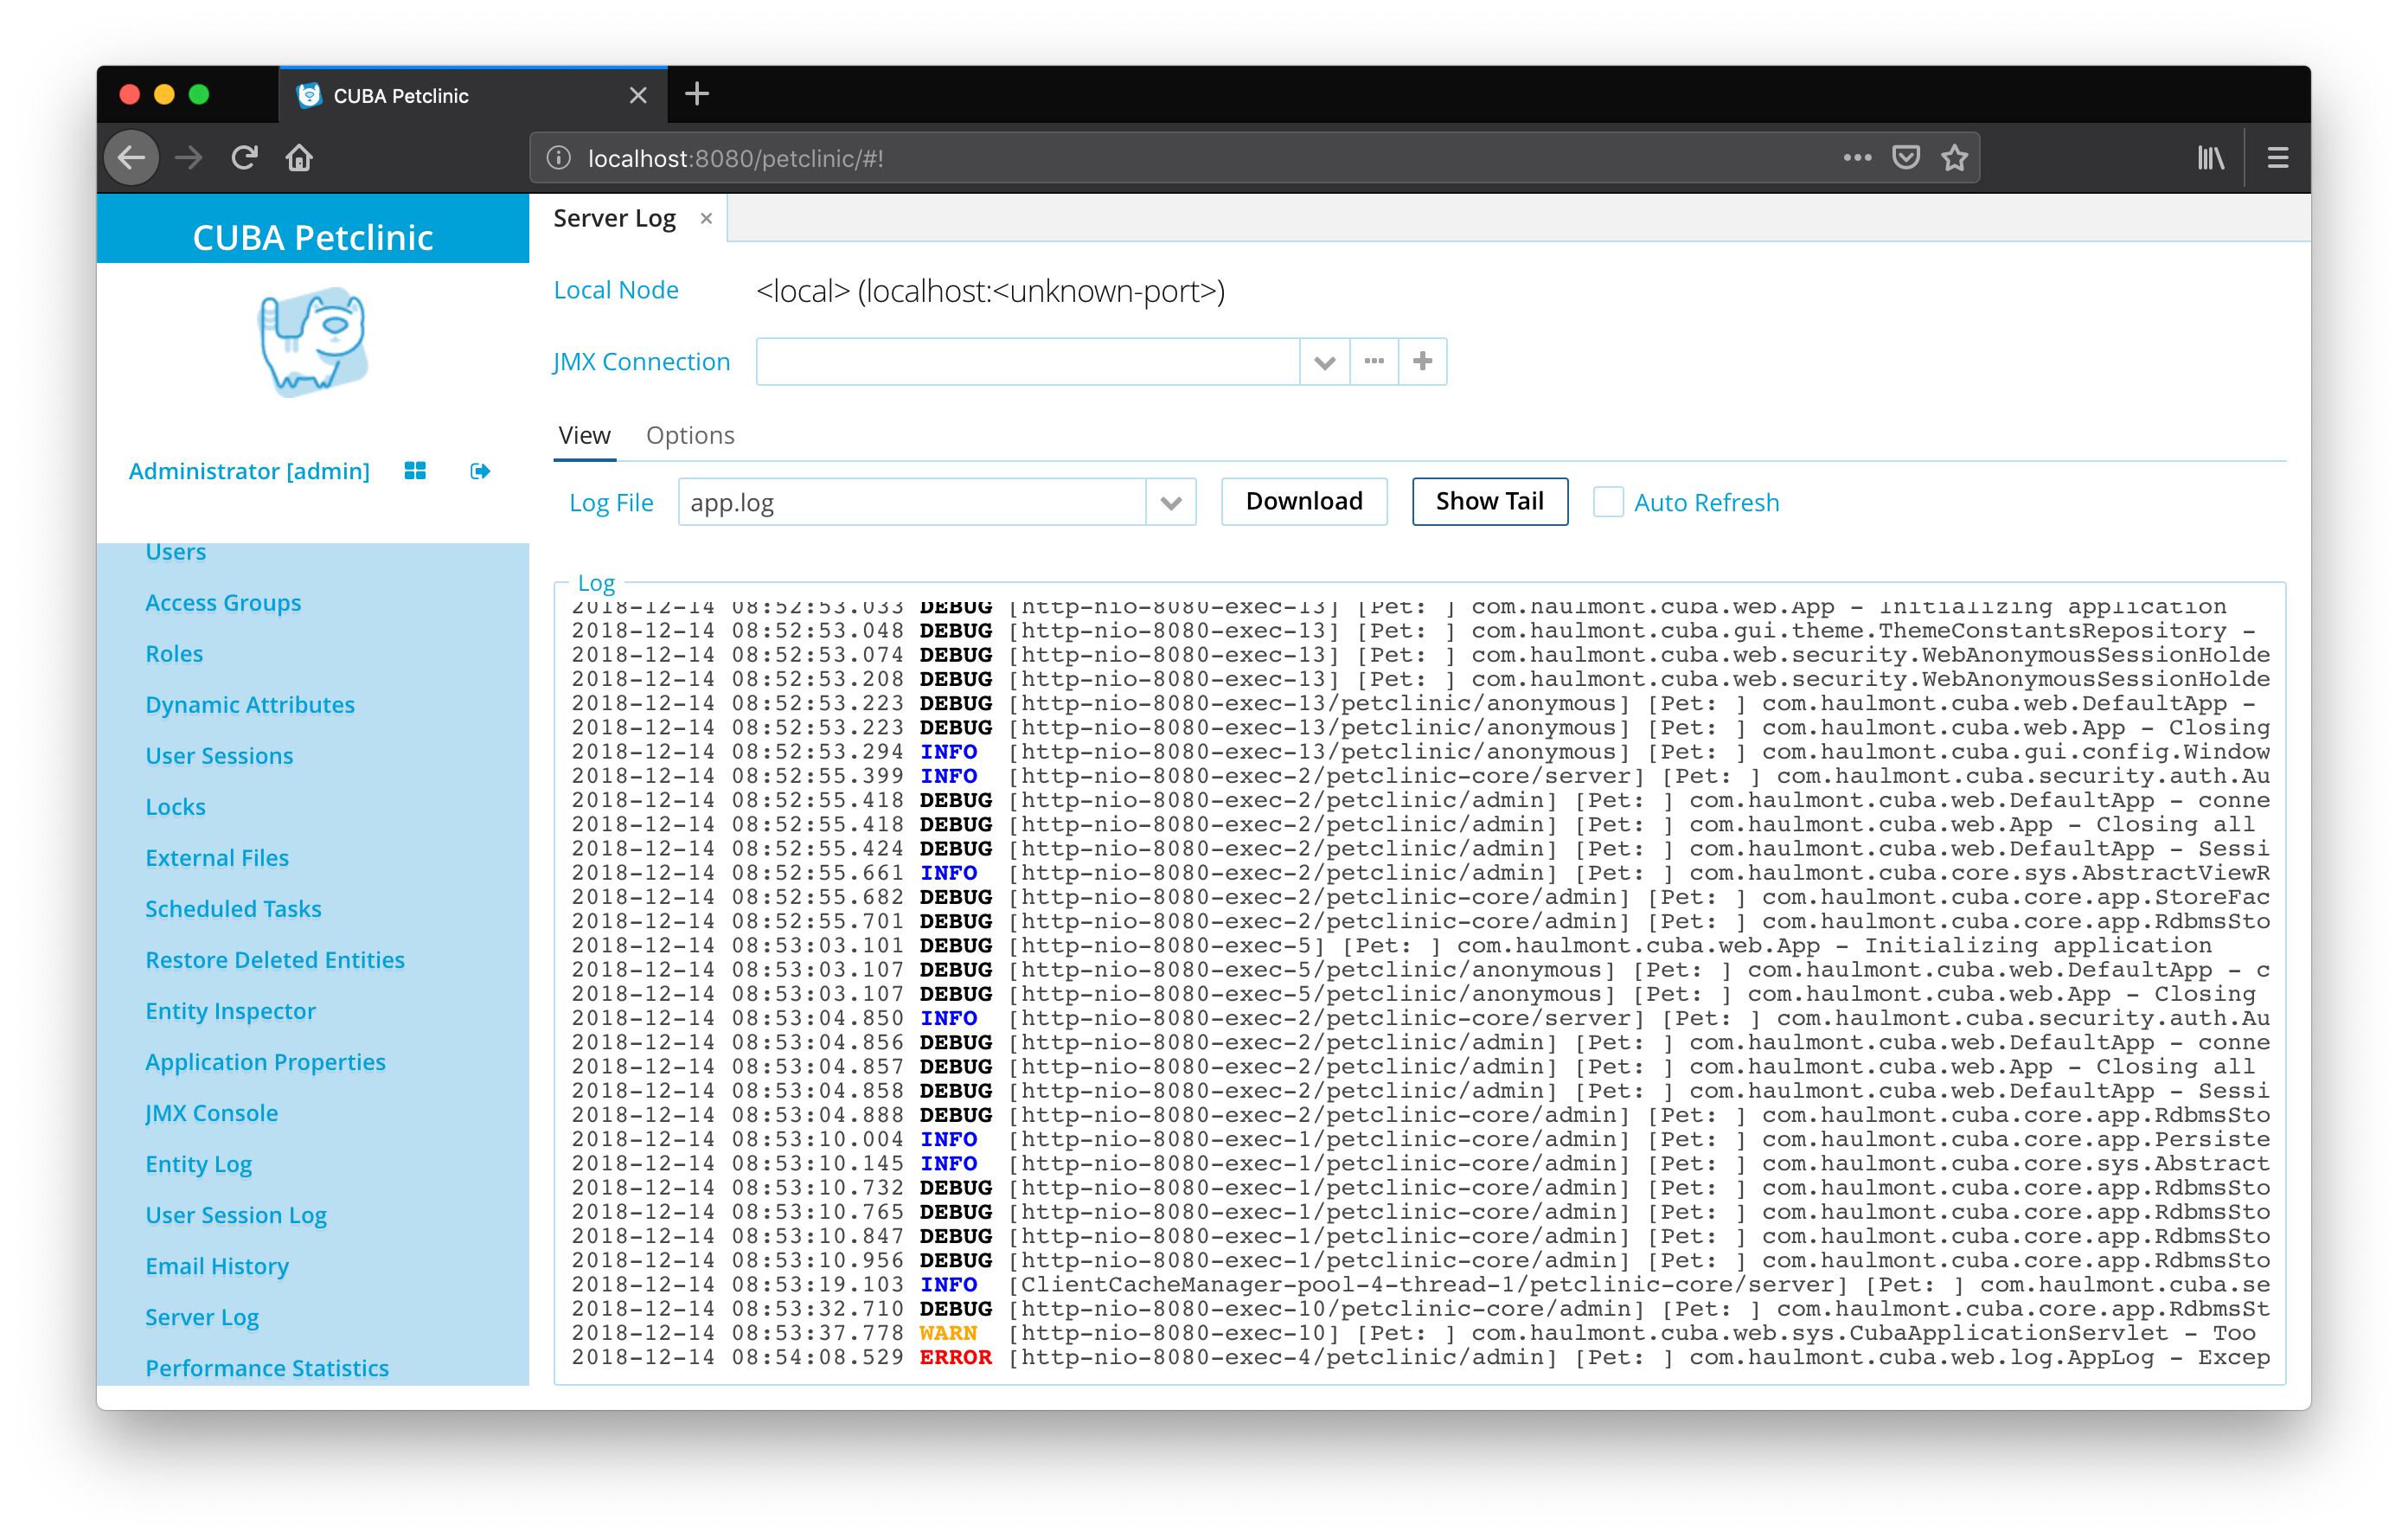
The UI allows the user to display different log files or download them for later use. It gives also non-administrator roles access to the logs, while it is still possible to restrict access only to allowed roles.
Logging Levels
Information that should be logged is of different types in multiple dimensions. In order to reason about the messages quickly and help the log message reader to distinguish between signal and noise, all logging libraries offer one very important dimension to categorize the messages: the Log level.
The log level can show how critical / urgent the message is. It is important to note that the log levels are ordered and based on each other. Slf4J defines the following logging levels that can be used in an application:
-
TRACE
-
DEBUG
-
INFO
-
WARN
-
ERROR
-
FATAL
DEBUG log messages on the one end are normally used for information that helps to identify the internal state of the application for application developers.
ERROR and FATAL are normally used in cases where an unexpected situation within the application occurred up to the point where the application cannot fulfill its purpose anymore.
Adjust Logging Configuration
Logback (alongside with other logging libraries) allows customization on how and where the log information is processed and written to the output, mainly through the already mentioned appender concept.
Generally there are two options to adjust the configuration of logback. On the one side, there is a configuration file called logback.xml where the configuration can be expressed. These adjustments happen at deployment time. Alternatively, logback can (to a certain extent) be configured at runtime. CUBA offers a UI for adjusting logging configuration for this purpose (Administration > Server Log > Options).
At Deployment: logback.xml Configuration File
The configuration file logback.xml is the main place to adjust the configuration of logback. In a CUBA application this file is located in deploy/tomcat/conf/logback.xml (in case of fast deployment option). It looks like this:
<configuration debug="false" packagingData="true">

    <property name="logDir" value="${catalina.base}/logs"/> (1)

    <appender name="File" class="ch.qos.logback.core.rolling.RollingFileAppender"> (2)
        <file>${logDir}/app.log</file>

        <filter class="ch.qos.logback.classic.filter.ThresholdFilter">
            <level>DEBUG</level>
        </filter>

        <encoder>
            <pattern>%d{yyyy-MM-dd HH:mm:ss.SSS} %-5level [%thread%X{cubaApp}%X{cubaUser}] %logger - %msg%n</pattern> (3)
        </encoder>
    </appender>

    <appender name="Console" class="ch.qos.logback.core.ConsoleAppender"> (4)
        <encoder>
            <pattern>%d{HH:mm:ss.SSS} %-5level %-40logger{36}- %msg%n</pattern>
        </encoder>
    </appender>

    <root>
        <appender-ref ref="Console"/>
        <appender-ref ref="File"/>
    </root>

    <logger name="com.haulmont.sample.petclinic" level="DEBUG"/> (5)
    <logger name="com.haulmont.cuba" level="DEBUG"/>
    <logger name="com.haulmont.cuba.core.sys" level="INFO"/>

    <!-- ... -->

</configuration>| 1 | logDir is a variable defined for the configuration, it describes where the file-based log files should be placed. It uses a special variable catalina.base from tomcat to reference the installation directory |
| 2 | A file appender to write log messages to the logfile app.log |
| 3 | pattern configures how a single log message line within the file should look like |
| 4 | Another appender writes the log messages to STDOUT (with different options) |
| 5 | Logging levels can be configured on a per class / package basis |
CUBA by default configures multiple log appenders. An appender describes where the log information should be written to. There are multiple appenders available out of the box. Each appender has options to configure its behavior (like how the log message should be formatted, which information should be logged etc.). Common Log appenders are FileAppender and ConsoleAppender.
The configuration of loggers allows defining the threshold on a per class / package basis. This means that for certain sub-parts of the application, it is possible to get log messages that have been written as DEBUG while for other parts it is only necessary to see log messages of WARN and ERROR.
In the example above the package com.haulmont.sample.petclinic is set to level DEBUG. This means that it will output all log messages that have at least the DEBUG level. Due to the semantic order of the log levels INFO, WARN, ERROR and FATAL will also be logged for this package. TRACE log messages, on the other hand, will not be displayed.
Depending on how the application is deployed there are several options on where to place the logback.xml file. Besides the above mentioned fast deployment, the logback.xml can be placed within the application itself or configure it to be outside of the application at a given path. See Further Information for more information.
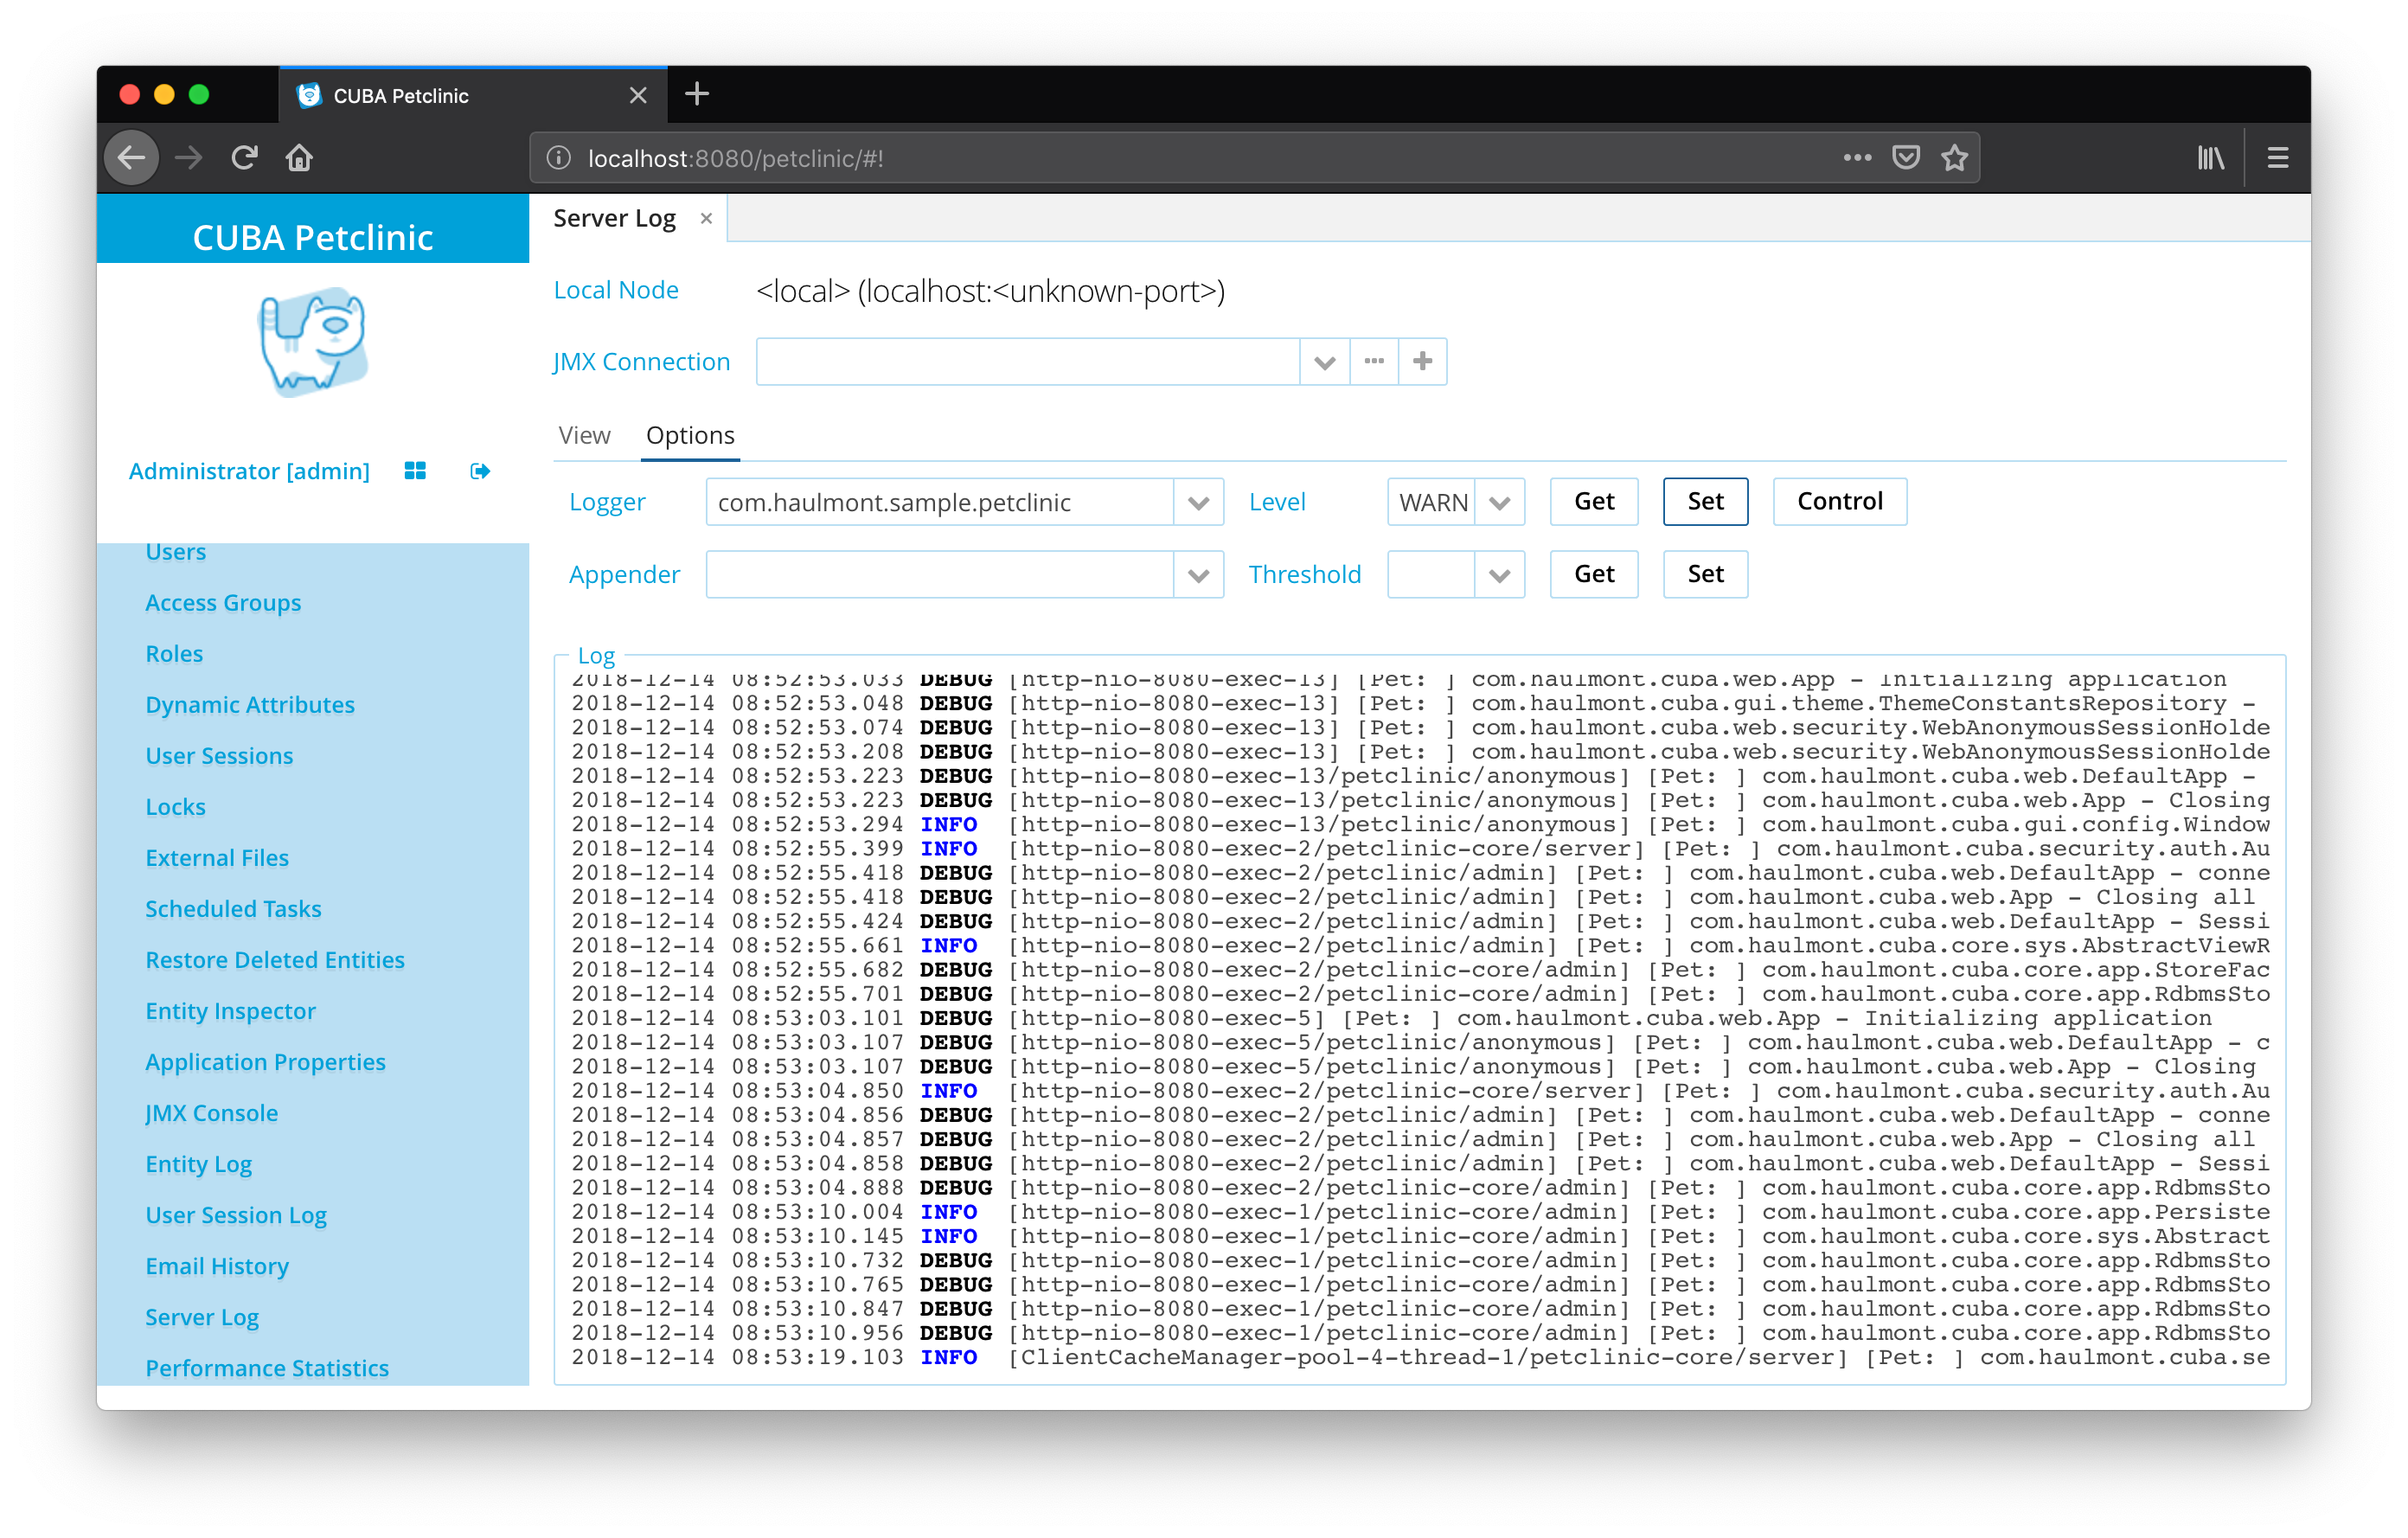
At Runtime: CUBA Logging UI
Adjusting the configuration of the file requires a restart of the application. For temporary debugging sessions, it is oftentimes helpful not to have to restart the server only to adjust the logging level or a certain subpart of the application code.
For this use-case, a CUBA application allows reconfiguring the levels of existing loggers and also add loggers at runtime through a user interface.
Set Logging Context with MDC
Once the application has a certain amount of logging information certain information gets repeated in a lot of logging messages. In the petclinic example, a lot of log messages would contain the Pet ID in order to get the context information in a fast manner. For those kinds of information, there is a context in Logback, called MDC.
MDC allows setting certain values into a context, that gets logged every time alongside with the actual logging message. This way the context can be set once and the developer writing the actual logging statement does not need to include it into the log message anymore.
CUBA itself uses MDC in order to attach different context values to the logging messages. Mainly those are the current user as well as the current application. This means that the resulting logging messages can be filtered by users.
In the example of the petclinic, the PetContactFetcherBean leverages the MDC context in the following manner: directly after invoking the method Optional<Contact> findContact(Pet pet) the identification number of the Pet is set into the MDC context like this:
@Component(PetContactFetcher.NAME)
public class PetContactFetcherBean implements PetContactFetcher {

    private static final Logger log = LoggerFactory.getLogger(PetContactFetcherBean.class);

    @Override
    public Optional<Contact> findContact(Pet pet) {

        MDC.put("petId", pet.getIdentificationNumber()); (1)

        log.debug("Searching Contact for Pet"); (2)

        try {
            Optional<Owner> petOwner = loadOwnerFor(pet);

            if (petOwner.isPresent()) {
                log.debug("Found Owner: {}", petOwner);

                // ...

                if (isAvailable(telephone)) {
                    return createContact(telephone, ContactType.TELEPHONE);
                }

                // ...

            } else {
                return Optional.empty();
            }
        } finally {
            MDC.remove("petId"); (4)
        }
    }

    private Optional<Contact> createContact(String contactValue, ContactType contactType) {

        Contact contact = new Contact();
        contact.setValue(contactValue);
        contact.setType(contactType);

        log.info("Contact created: {}", contact); (3)

        return Optional.of(contact);
    }

    // ...
}| 1 | The Pet’s identification number is registered in the context under the key petId |
| 2 | The following logging messages do not need to include the Pet ID within the log message itself |
| 3 | The lifetime of value in the MDC is independent of method boundaries |
| 4 | The key petId of the MDC is cleaned up at the end of the method |
Now that the MDC has values in it, the next step is to reconfigure logback in order to see the dedicated MDC values in the log output.
<configuration debug="false" packagingData="true">

    <!-- ... -->

    <appender name="File" class="ch.qos.logback.core.rolling.RollingFileAppender">

        <!-- ... -->

        <encoder>
            <pattern>%d{yyyy-MM-dd HH:mm:ss.SSS} %-5level [%thread%X{cubaApp}%X{cubaUser}] [Pet: %X{petId}] %logger - %msg%n</pattern> (1)
        </encoder>

    </appender>

    <!-- ... -->

</configuration>| 1 | %X{petId} takes the value with the key petId of the MDC and writes it to the log file |
The resulting logging output contains the Pet identification number:
2018-12-13 08:54:41.345 DEBUG [http-nio-8080-exec-7/petclinic/admin] [Pet: 205] c.h.s.p.c.PetContactFetcherBean - Searching Contact for Pet
2018-12-13 08:54:41.354 DEBUG [http-nio-8080-exec-7/petclinic-core/admin] [Pet: 205] c.h.c.c.a.RdbmsStore - load: metaClass=petclinic_Owner, id=79fa17b9-a130-207d-5091-f79cceb9cf99, view=com.haulmont.sample.petclinic.entity.owner.Owner/_local
2018-12-13 08:54:41.371 DEBUG [http-nio-8080-exec-7/petclinic/admin] [Pet: 205] c.h.s.p.c.PetContactFetcherBean - Found Owner: Optional[com.haulmont.sample.petclinic.entity.owner.Owner-79fa17b9-a130-207d-5091-f79cceb9cf99 [detached]]
2018-12-13 08:54:41.374 INFO  [http-nio-8080-exec-7/petclinic/admin] [Pet: 205] c.h.s.p.c.PetContactFetcherBean - Contact created: TELEPHONE: 0049817312
The log entries now contain the following part of the message: [Pet: 205]. This context entry is also used for CUBA internal logging messages like the logging message of the RdbmsStore.
MDC has the following advantages over putting context values directly into the log message:
-
log messages are homogeneous for all logging messages
-
log messages are structured allowing for explicit search
-
the definition of the context can be extracted into a single place of the source code
Logging to Centralized Logging Solution
Having very detailed information about the execution of the running application is very important. But having to deal with a huge amount of log data is challenging. Storing this information in the filesystem of the server is not very accessible and also not very efficient to work with. This is why oftentimes centralized logging solutions are used for storing and accessing the log information.
A very common open source centralized logging system is based on Elasticsearch - a full-text search data store that turned out to be a great fit for the logging use case.
Logback integrates easily with centralized logging solutions via the concept of appender. In the configuration file, there were already two appenders configured for the application: ConsoleAppender and FileAppender.
For Elasticsearch there is a Logback Appender, that will directly send the logging information to the elasticsearch cluster instead of putting the log messages into a file. There are different options on how to configure logging to Elasticsearch (aka ELK-Stack). As this guide mainly deals with the integration with Logback within the application, configuring the Elasticsearch server in a production-ready way is out of scope.
In order to use Elasticsearch as a log storage backend, a dependency needs to be added to the CUBA application. In the build.gradle file the following dependency has to be added to all modules: runtime "com.internetitem:logback-elasticsearch-appender:1.6"
The logback.xml configuration file should be extended to contain an additional appender:
<configuration debug="false" packagingData="true">

    <!-- ... -->

    <appender name="elasticsearch" class="com.internetitem.logback.elasticsearch.ElasticsearchAppender"> (1)
        <url>${ELASTICSEARCH_CLUSTER_URL}</url> (2)
        <index>cuba-petclinic-logs-%date{yyyy-MM-dd}</index> (3)
        <type>cuba-petclinic</type>
        <errorLoggerName>es-error-logger</errorLoggerName>
        <includeMdc>true</includeMdc>
        <properties>
            <property>
                <name>host</name>
                <value>${HOSTNAME}</value>
                <allowEmpty>false</allowEmpty>
            </property>
            <property>
                <name>severity</name>
                <value>%level</value>
            </property>
            <property>
                <name>thread</name>
                <value>%thread</value>
            </property>
            <property>
                <name>logger</name>
                <value>%logger</value>
            </property>
            <property>
                <name>stacktrace</name>
                <value>%ex</value>
            </property>
        </properties>
    </appender>

    <!-- ... -->

</configuration>| 1 | An elasticsearch appender of ElasticsearchAppender type is registered for the application |
| 2 | The URL of the elasticsearch cluster is extracted from the environment variables |
| 3 | The elasticsearch index for the application logs is cuba-petclinic-logs-%date{yyyy-MM-dd} with a daily rotation |
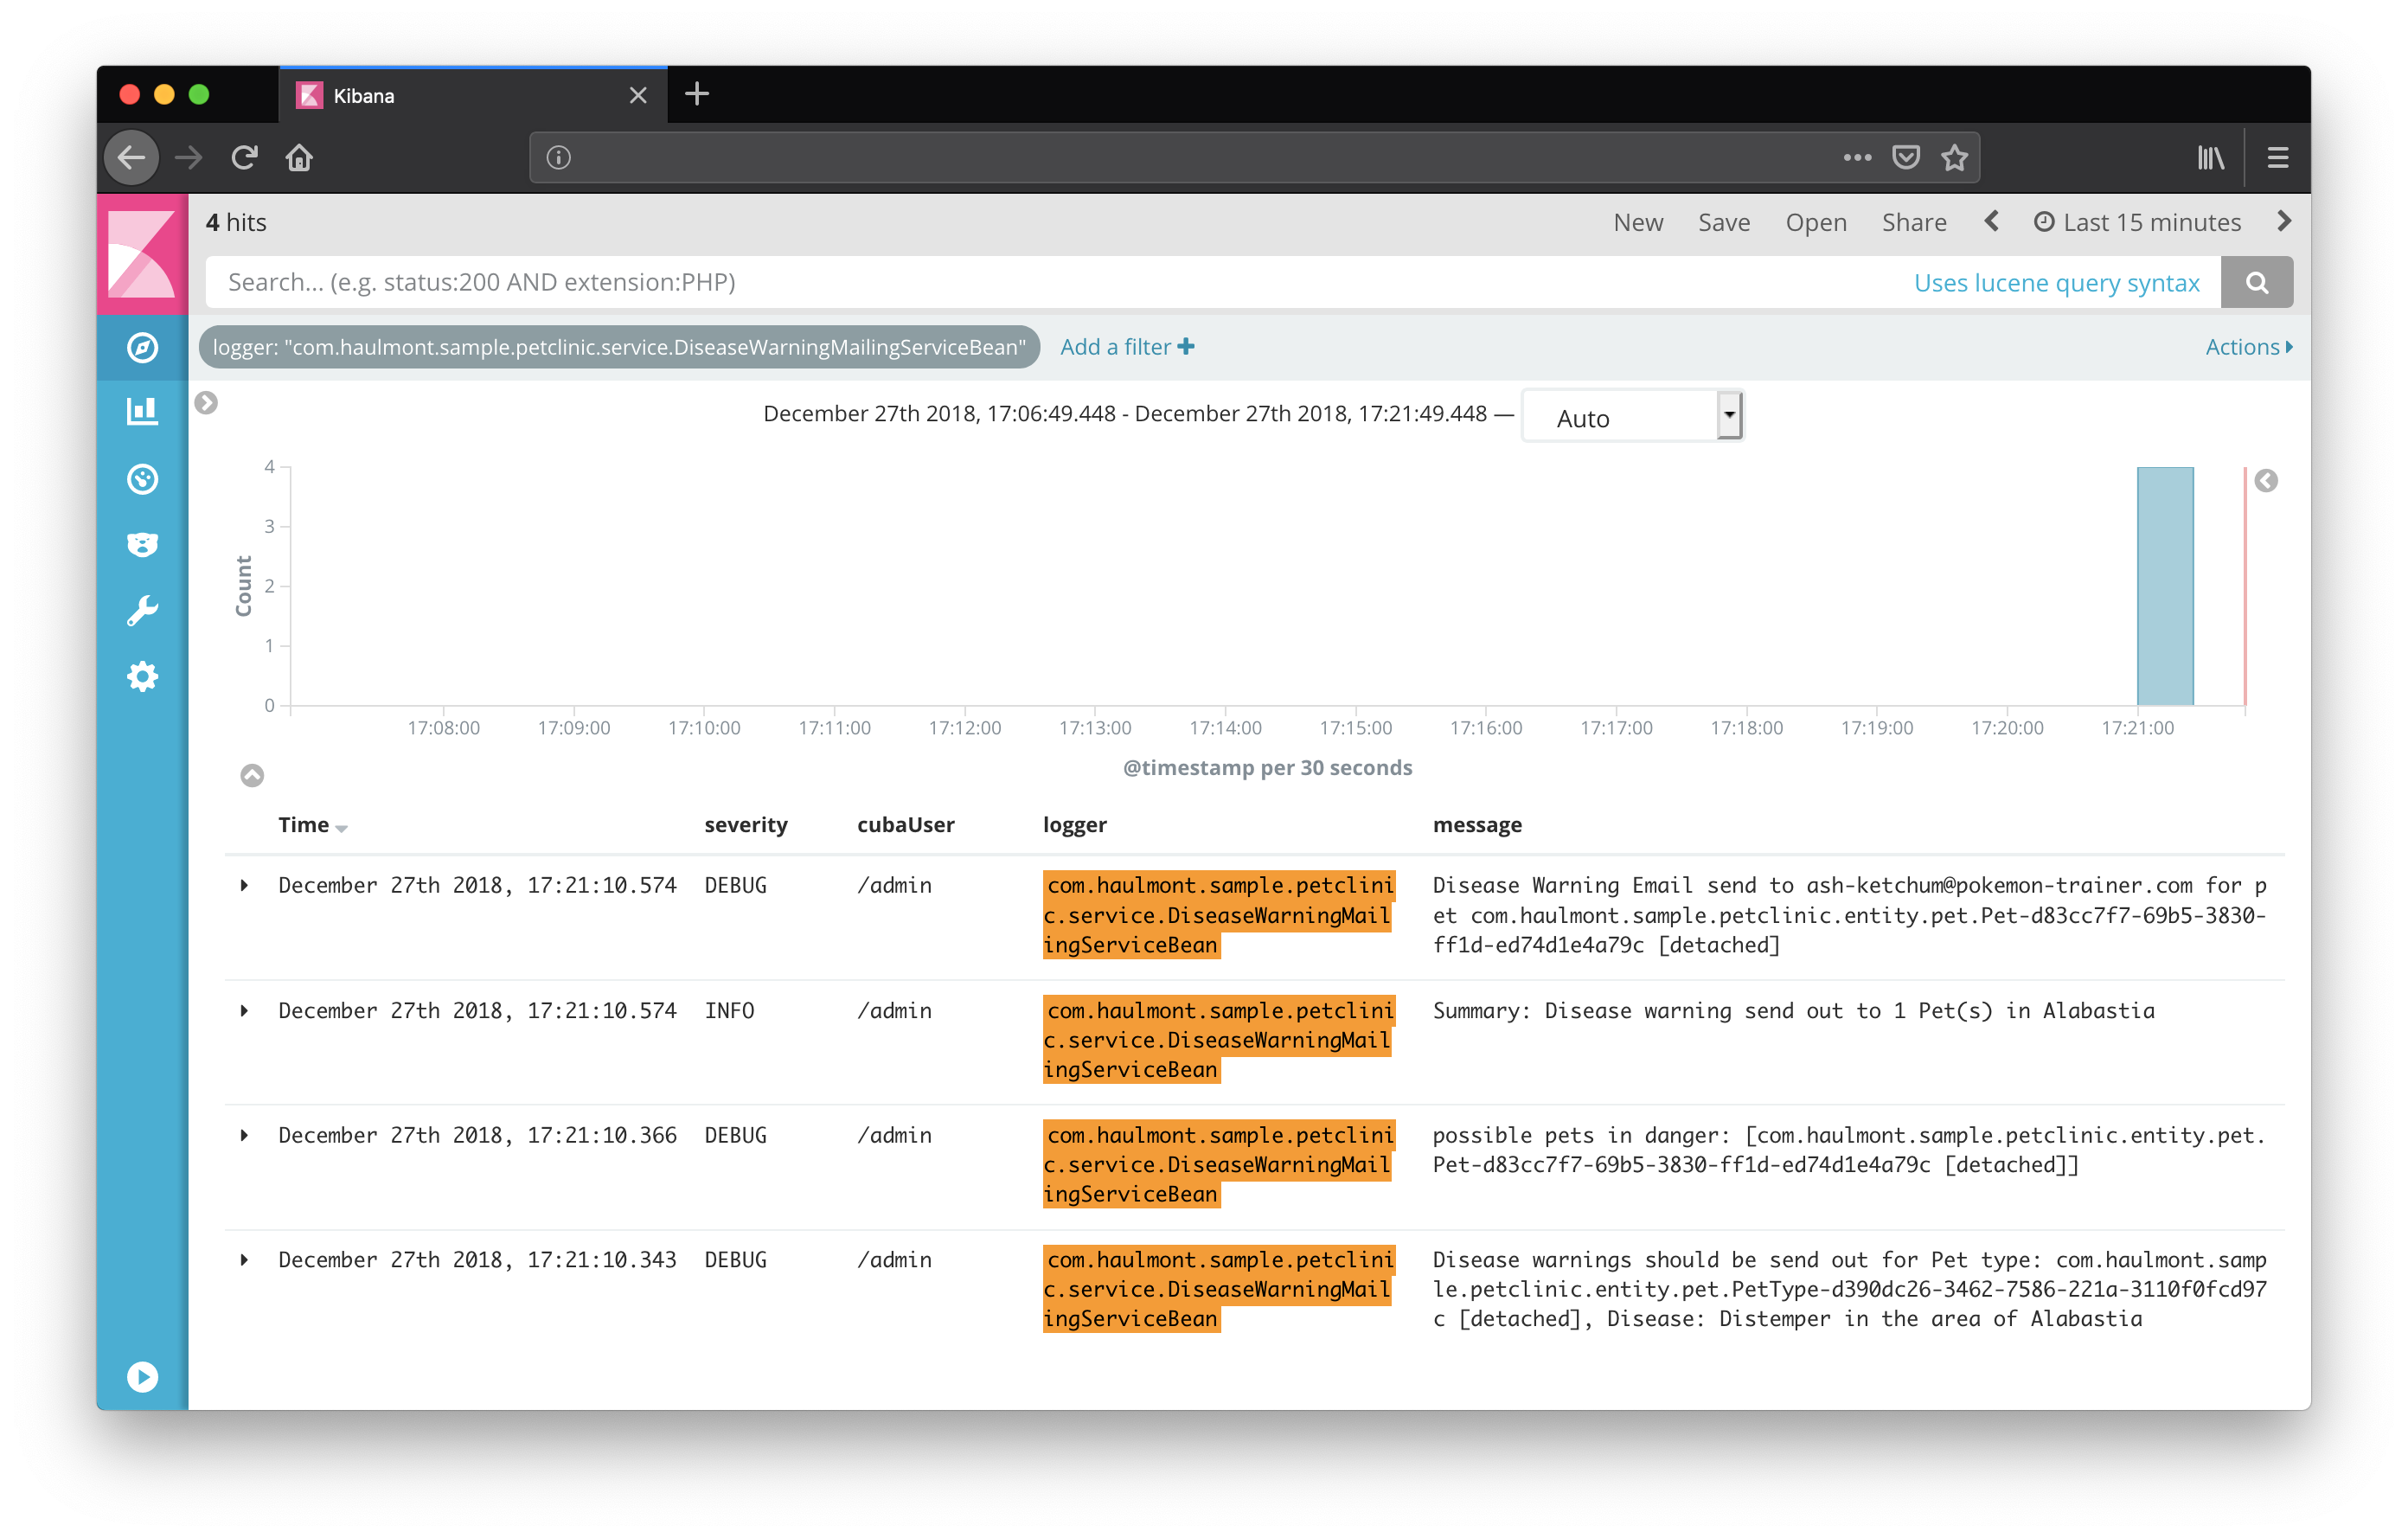
With that configuration in place, the application will take the log messages and send them to elasticsearch. Kibana as a user interface for accessing data in elasticsearch is capable of displaying the log information properly. Via the structured as well as full-text search capabilities, the log information can be accessed in a much easier way compared to direct access to the log files.
Summary
Logging is an essential part for developers and administrators to reason about a running application. It enables developers to observe a system through opening up the "black-box" and getting valuable insights. The use cases go from debugging over performance analysis to observing user behavior.
The logging facilities in the Java and CUBA ecosystem are very mature and can be used without any friction. But as the logging API is so generic and usable in multiple ways, it heavily depends on conventions in order to get qualitative logging messages in the application. There are different mechanisms to not get overwhelmed by raw logging messages through proper logging configuration, diagnosis contexts (MDC) and logging levels.
CUBA offers an opinionated way of dealing with logging configuration and access to logs. But as it is based on standard Java logging mechanism it plays nicely with other solutions like centralized logging systems.

