

“Big Bang”
Rollout a complete replacement system in one go.


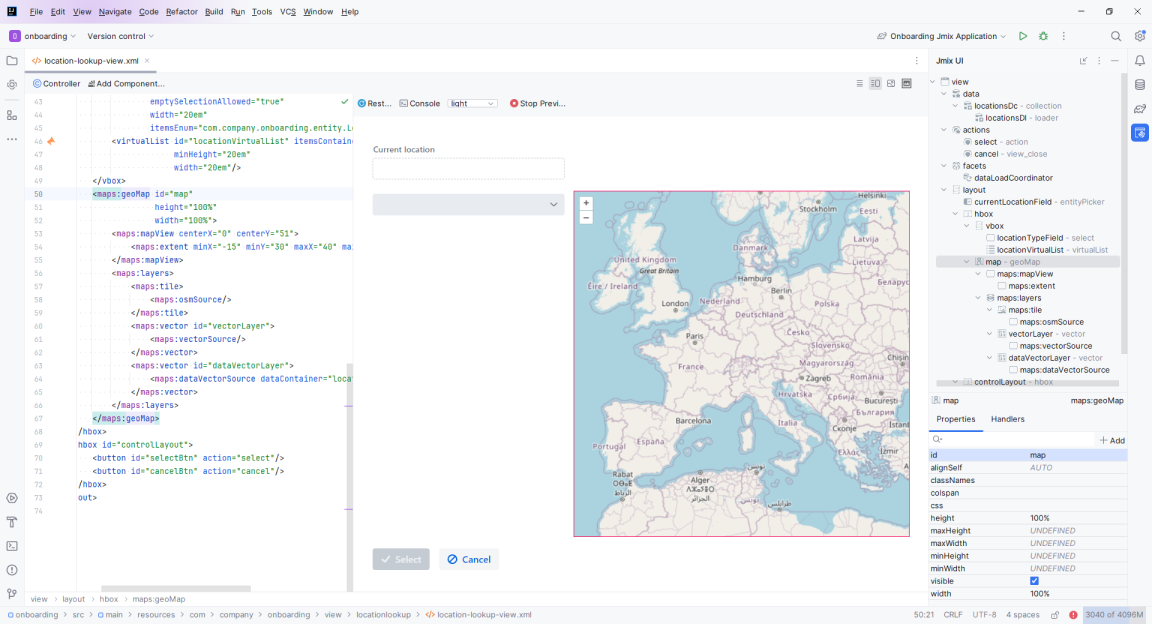
A map layer refers to a visual representation of specific geographic information or data overlaid on a base map.
Each layer typically contains distinct sets of data, and multiple layers can be stacked or combined to create a comprehensive and informative map display. These layers can be toggled on or off, allowing users to control which information they want to view at any given time.
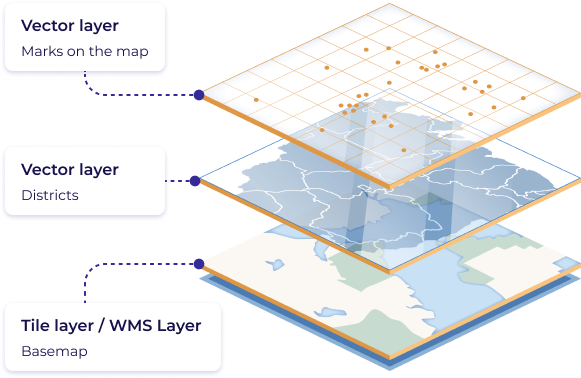
This is the foundational layer and serves as the geographic reference point for all the subsequent layers. It typically includes geographical features like roads, water bodies, and countries boundaries. It serves to provide context to the information displayed on top. The images for this layer are usually served over the web. Two of the most prevalent methods for retrieving images are:
This is a method where the map is divided into a grid of square tiles at various zoom levels. Each tile is a static image, typically a PNG or JPEG, that represents a specific geographic area at a particular level of detail. When you view a map on a web service, the tiles corresponding to your viewport and zoom level are loaded. As you pan or zoom in and out of the map, new tiles are requested from the server and loaded into the map to display the area you're interested in. This allows maps to be highly responsive and quick to navigate, as only the visible tiles need to be loaded rather than the entire map.
WMS is a standard protocol developed by the Open Geospatial Consortium for serving georeferenced map images over the internet. These images are generated by a map server using data from a GIS database. The key feature of WMS is that the images are created dynamically based on a user's request, which can specify not only the geographic area, zoom level, and image format but also which specific layers of data to include. This means that WMS can combine different data sources and layers to create a custom map that is sent to the user as a single image.
Overlay layers contain additional information overlaid on top of the base map. Layers can represent various types of data, including raster images or vector graphics. Vector layers consist of geometrical shapes (points, lines, polygons) defined by coordinates.
The way these layers work together is that they can be individually manipulated, turned on and off, or analyzed. For example, if one wanted to see where customers are located within a certain district, they could simply view those two layers together. This layered approach also allows for the analysis of spatial relationships and patterns, such as density of customers within districts, or how certain conditions might influence customer distribution.
Incorporating maps into Jmix applications offers a dynamic way to represent spatial data, such as tracking sales regions, customer distribution patterns, or the locations of various branches. This kind of visualization provides several key benefits:
By visualizing data such as sales territories, customer distribution, or branch locations, users can make informed, data-driven decisions, analyze trends, and understand geographical patterns more clearly.
Maps enable the tracking of vehicles in real-time, crucial for shipment tracking, fleet management, and overcoming logistical hurdles. This feature is essential for efficient navigation and logistics planning.
The integration of maps in applications powers location-based services, helping users find nearby points of interest like restaurants, hotels, gas stations, and other attractions, thereby enhancing user experience.
Maps facilitate the tracking and management of assets, including the location of infrastructure elements, IoT devices, and equipment, making it easier to oversee and coordinate these resources effectively.
Shapes on a map, including points, polylines, and polygons, have various applications across different industries and purposes. Here are some usage examples for each shape:
The Employee Onboarding application simplifies and automates the process of integrating new hires into the company.
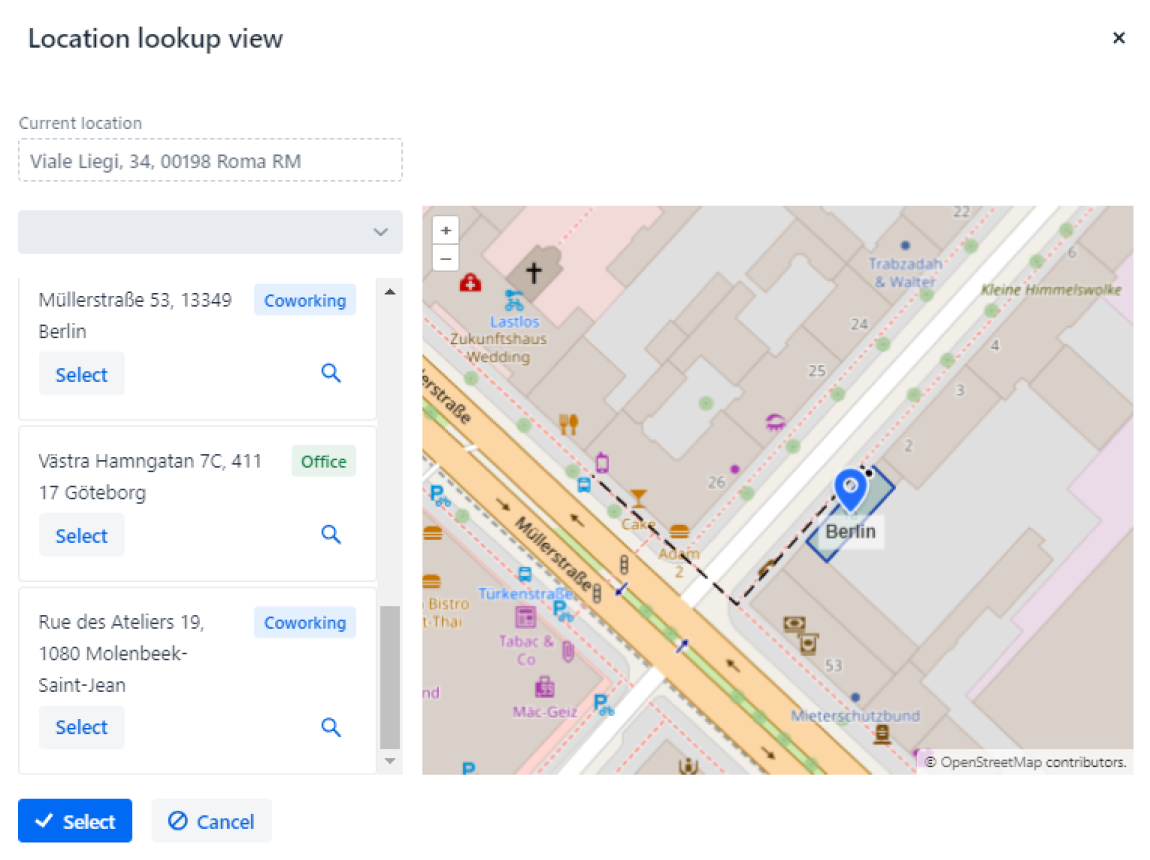
During this process, employees select their primary work location from available options displayed using the map component, simplifying the selection of their base workplace.
The application features an interactive map showcasing offices and available coworking spaces. Different markers denote various location categories; for instance, green markers represent coworking spaces, while blue markers indicate offices.
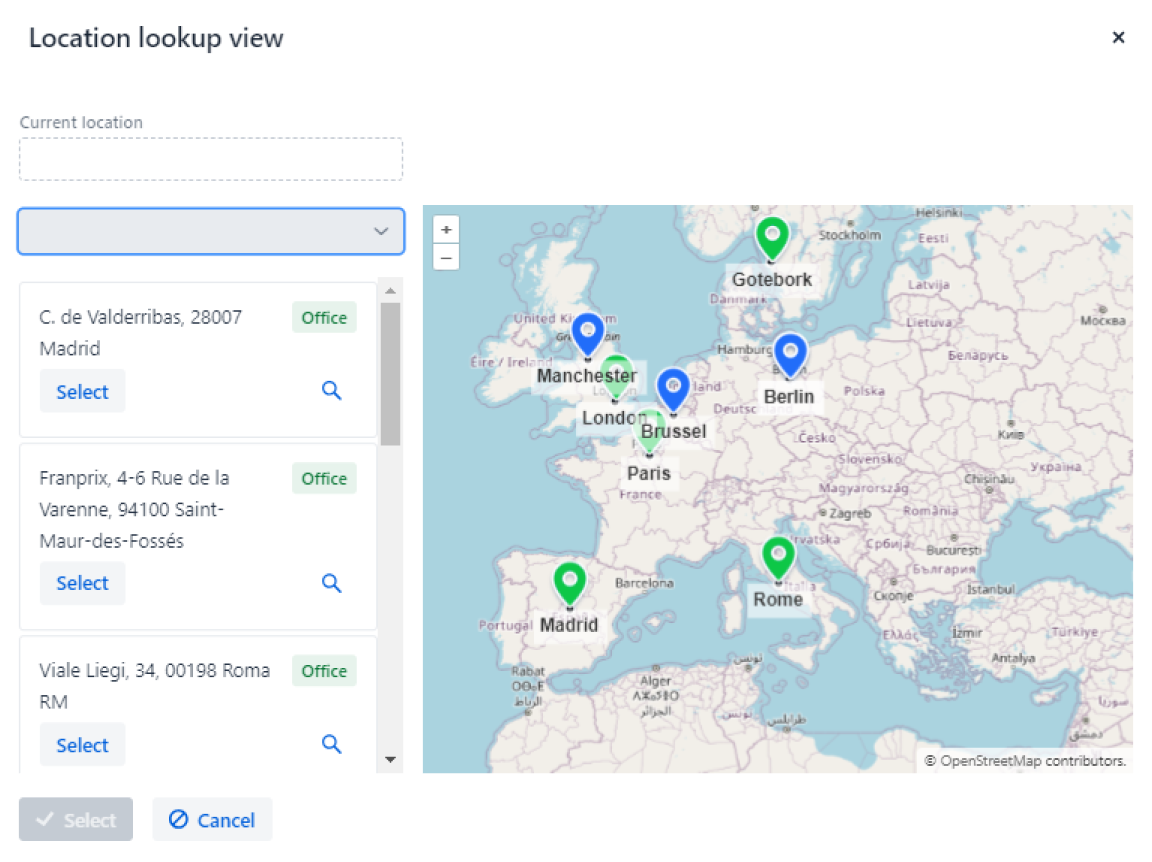
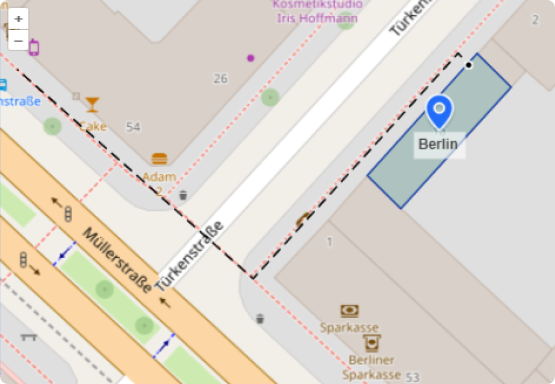
Users interact with the map by clicking the "Select" button to choose a specific location. Upon selection, the map zooms in and centers around the chosen point, providing a detailed view.
Within the building's context, polygons are utilized to outline distinct areas, defining the boundaries of offices. Meanwhile, polylines depict routes from the office to the nearest bus stop. Furthermore, a point is employed to precisely mark the location of the entrance.
Learn the step-by-step process of implementing this example through a comprehensive tutorial.