Overview
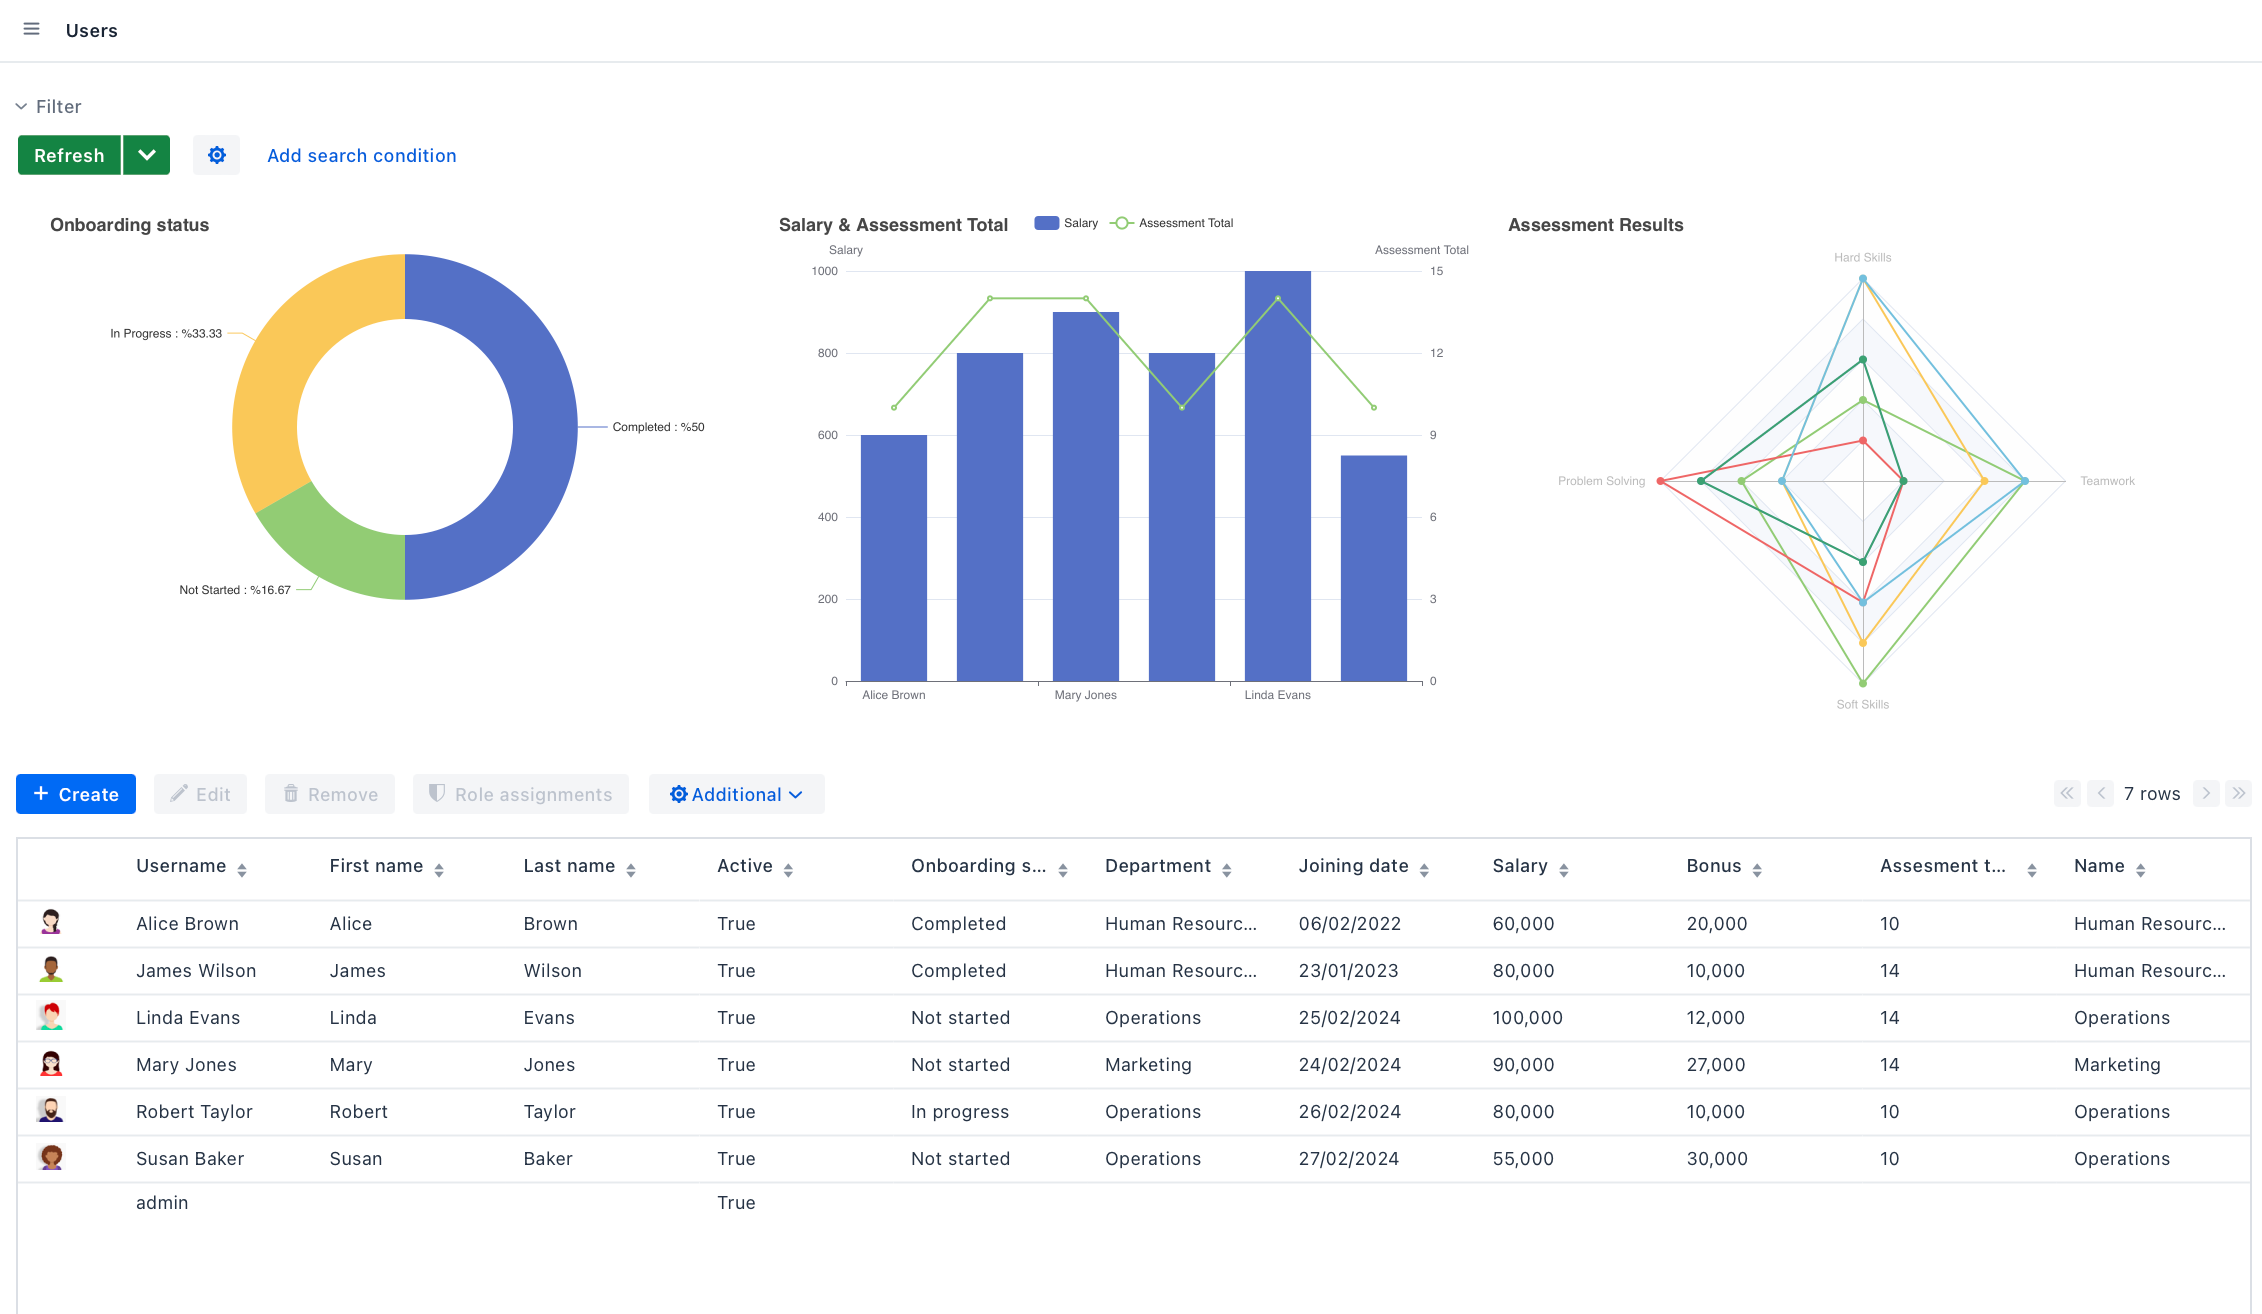
The Jmix Charts add-on integrates Apache ECharts, an open-source JavaScript visualization library, into Jmix. This integration enables developers to create a wide range of charts, providing a server-side API for easy binding to the backend data model and offering customization options for rich data visualization.
Use Cases
- Data Visualization and Analysis: Present complex data in understandable formats, aiding in data analysis and informed decision-making.
- Interactive Dashboards: Build dynamic dashboards with charts that respond to user input.
- Real-Time Data Monitoring: Display real-time data updates in charts for monitoring systems and devices, tracking metrics, or any application requiring live data visualization.
Key Features
- Wide Range of Chart Types: Support for various chart types, including line, bar, pie, scatter, candlestick, funnel, gauge, radar, and more, catering to diverse visualization needs.
- Server-Side API for Easy Data Binding: Simplify data binding to backend data models through a server-side API, allowing seamless integration with Jmix data containers and other data providers.
- Declarative Configuration: Configure charts using XML or Java code or native JSON, with properties matching Apache ECharts options.
- Multiple Series and Combined Charts: Include multiple series configurations in a single chart, allowing for combined charts and complex data representations.
- Customizable Visual Elements: Customize chart elements such as labels, tooltips, axes, and legends providing control over the chart's appearance and behavior.
Create interactive charts effortlessly. Install the add-on to get started!

