Overview
Jmix Pivot Table add-on introduces an interactive pivot table component to your Jmix applications, allowing users to transform data sets into dynamic summary tables using a drag-and-drop interface.
Use Cases
- Interactive data analysis: Empower users to explore and analyze data interactively, uncovering insights by rearranging, filtering, and summarizing data in runtime for customized views faster and without technical expertise.
- Ad-Hoc reporting: Allow end-users to create custom reports on the fly without the need for predefined report templates.
- Business intelligence dashboards: Integrate pivot tables into dashboards to provide users with powerful data exploration tools directly within your application.
- Standardized Reporting: Use read-only pivot tables with predefined settings to distribute consistent reports across the organization, ensuring all users see the same data representation.
Key Features
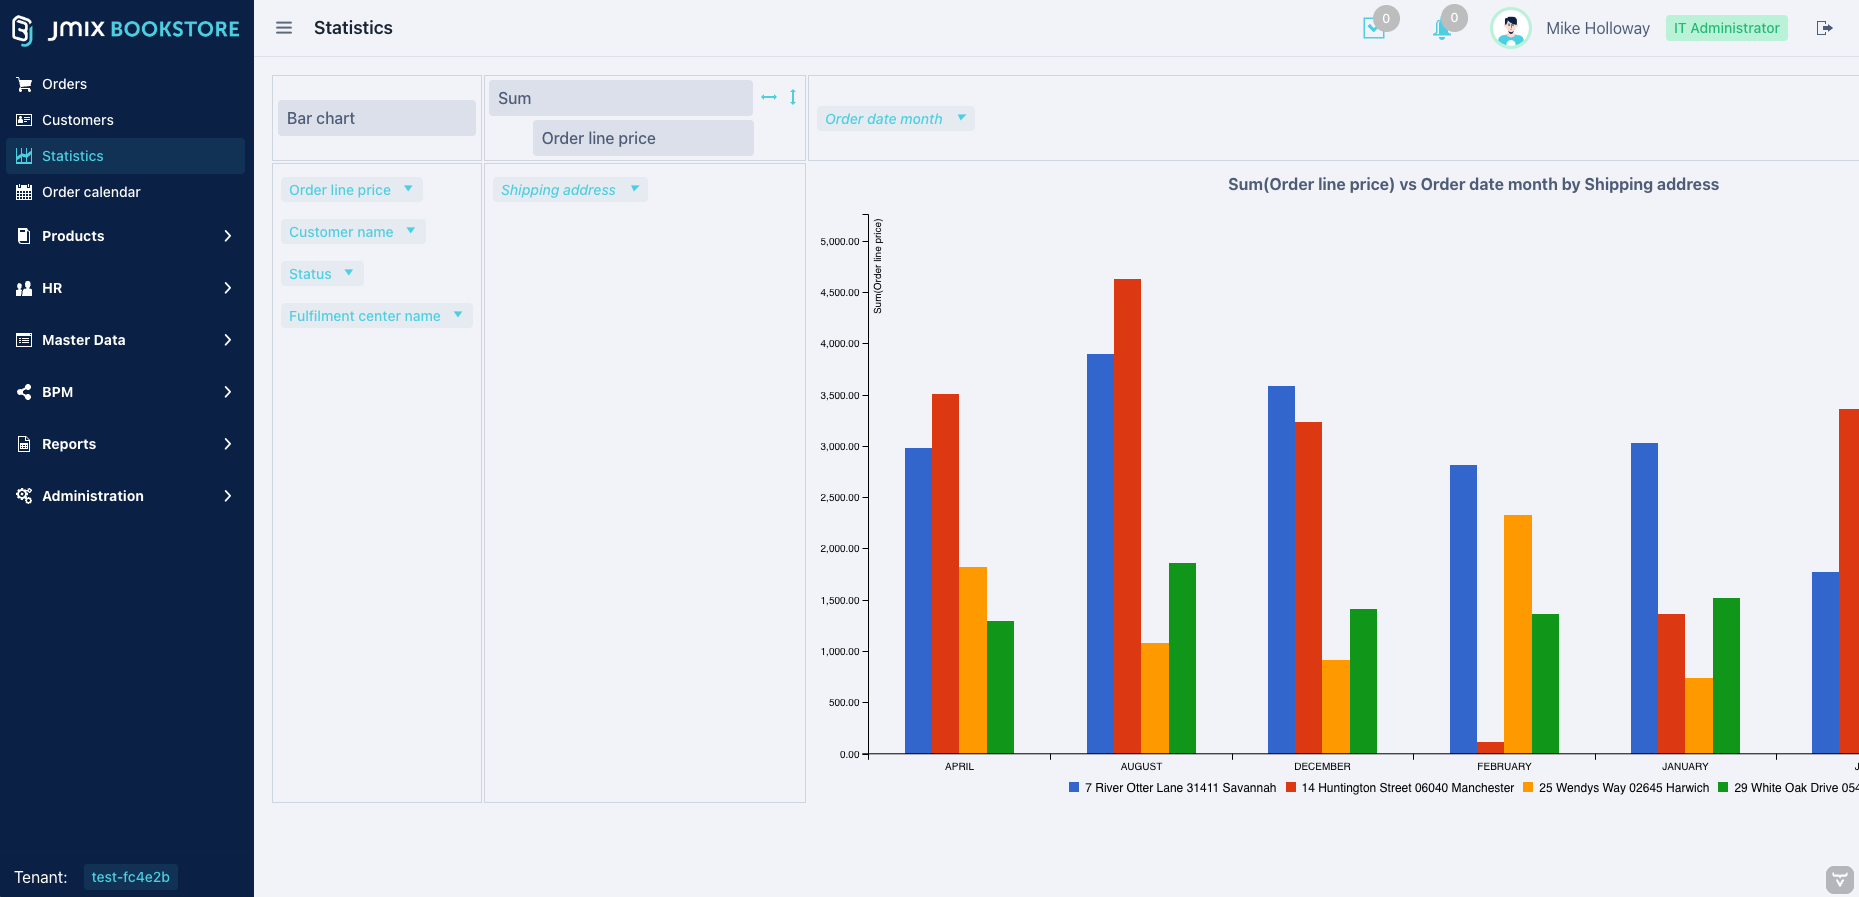
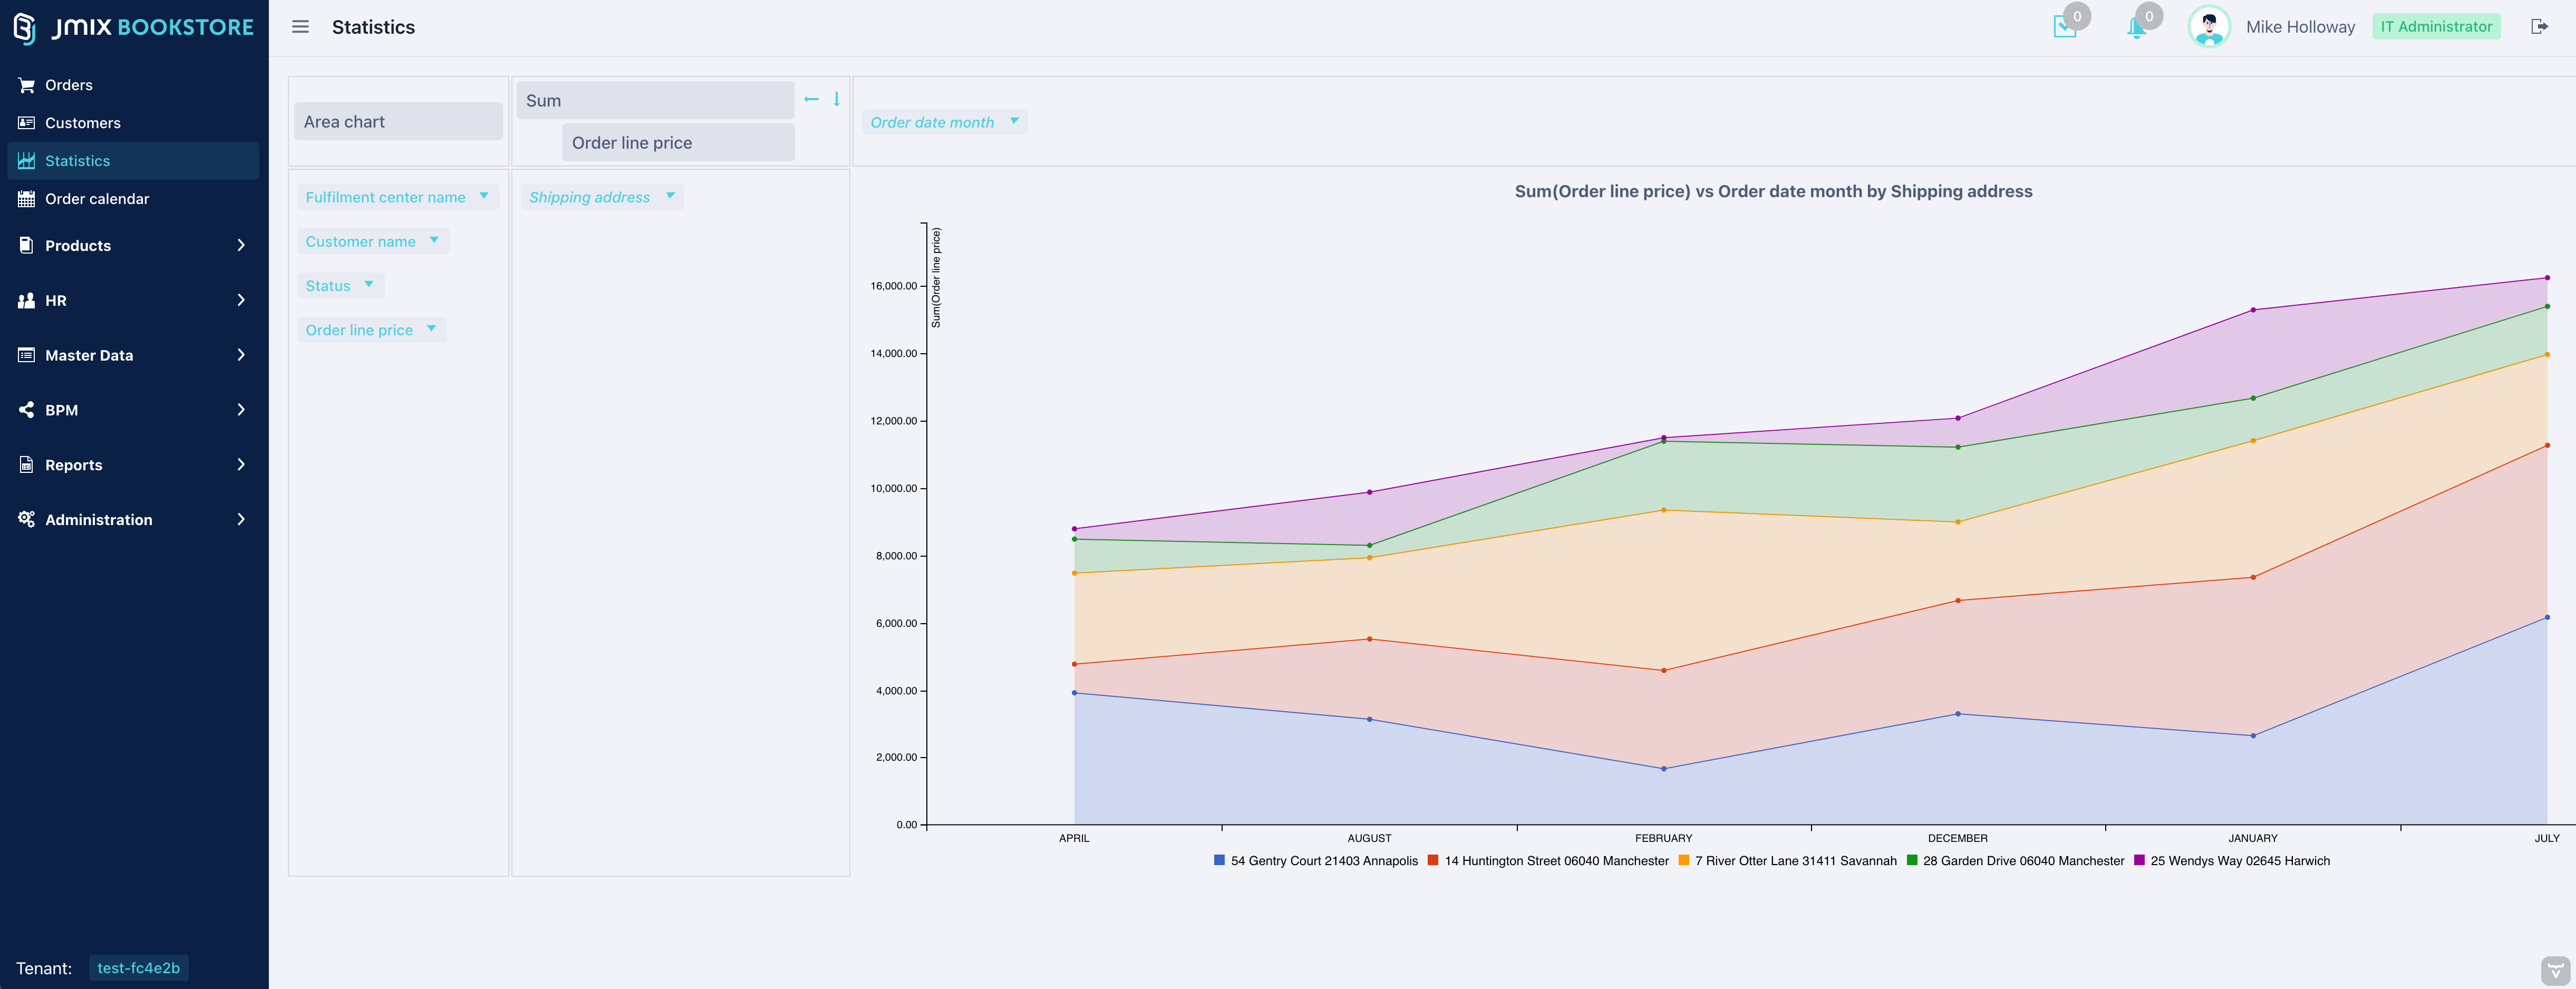
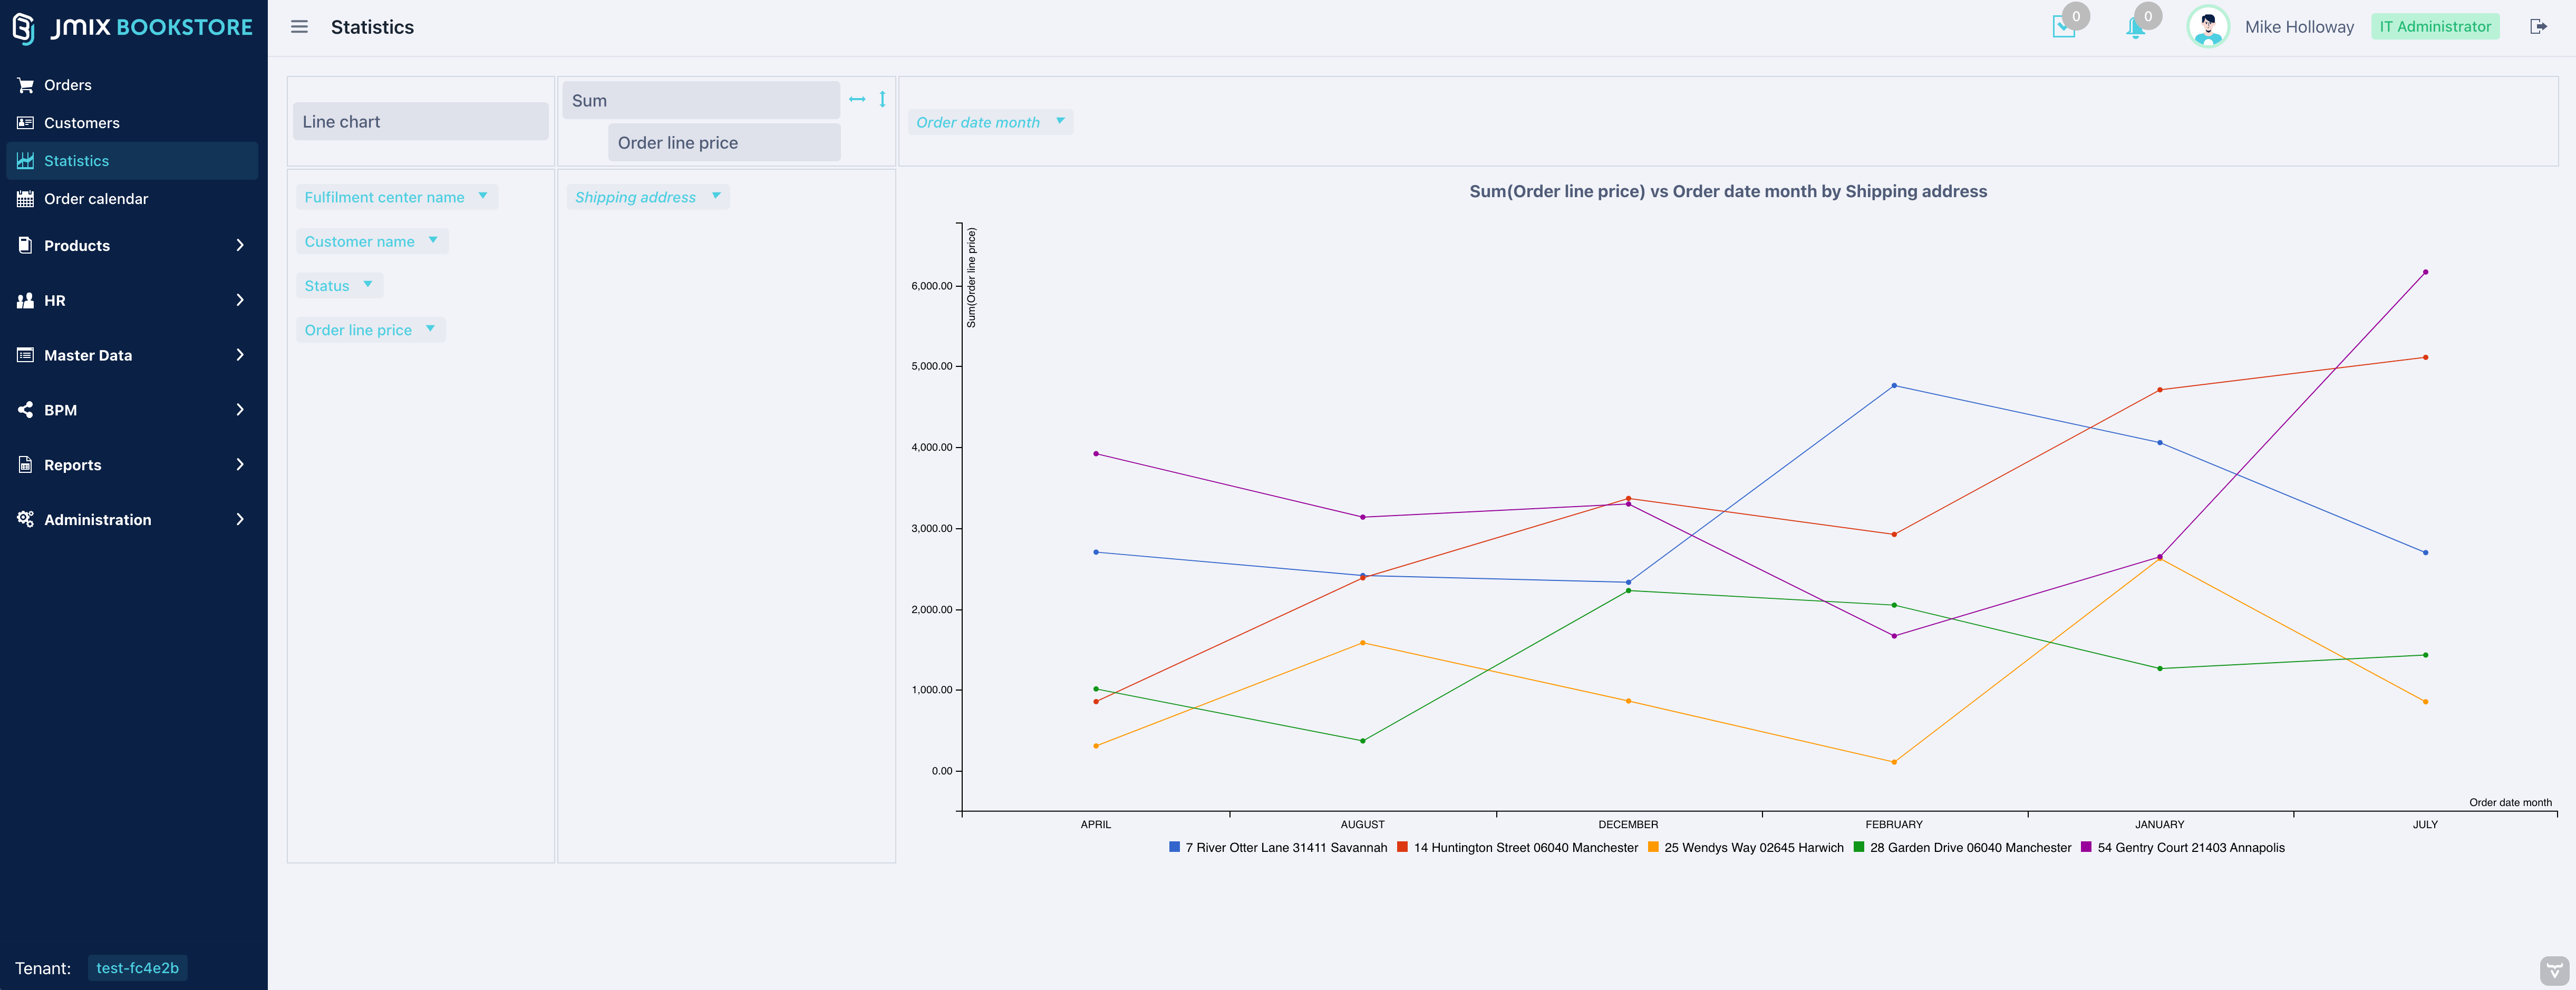
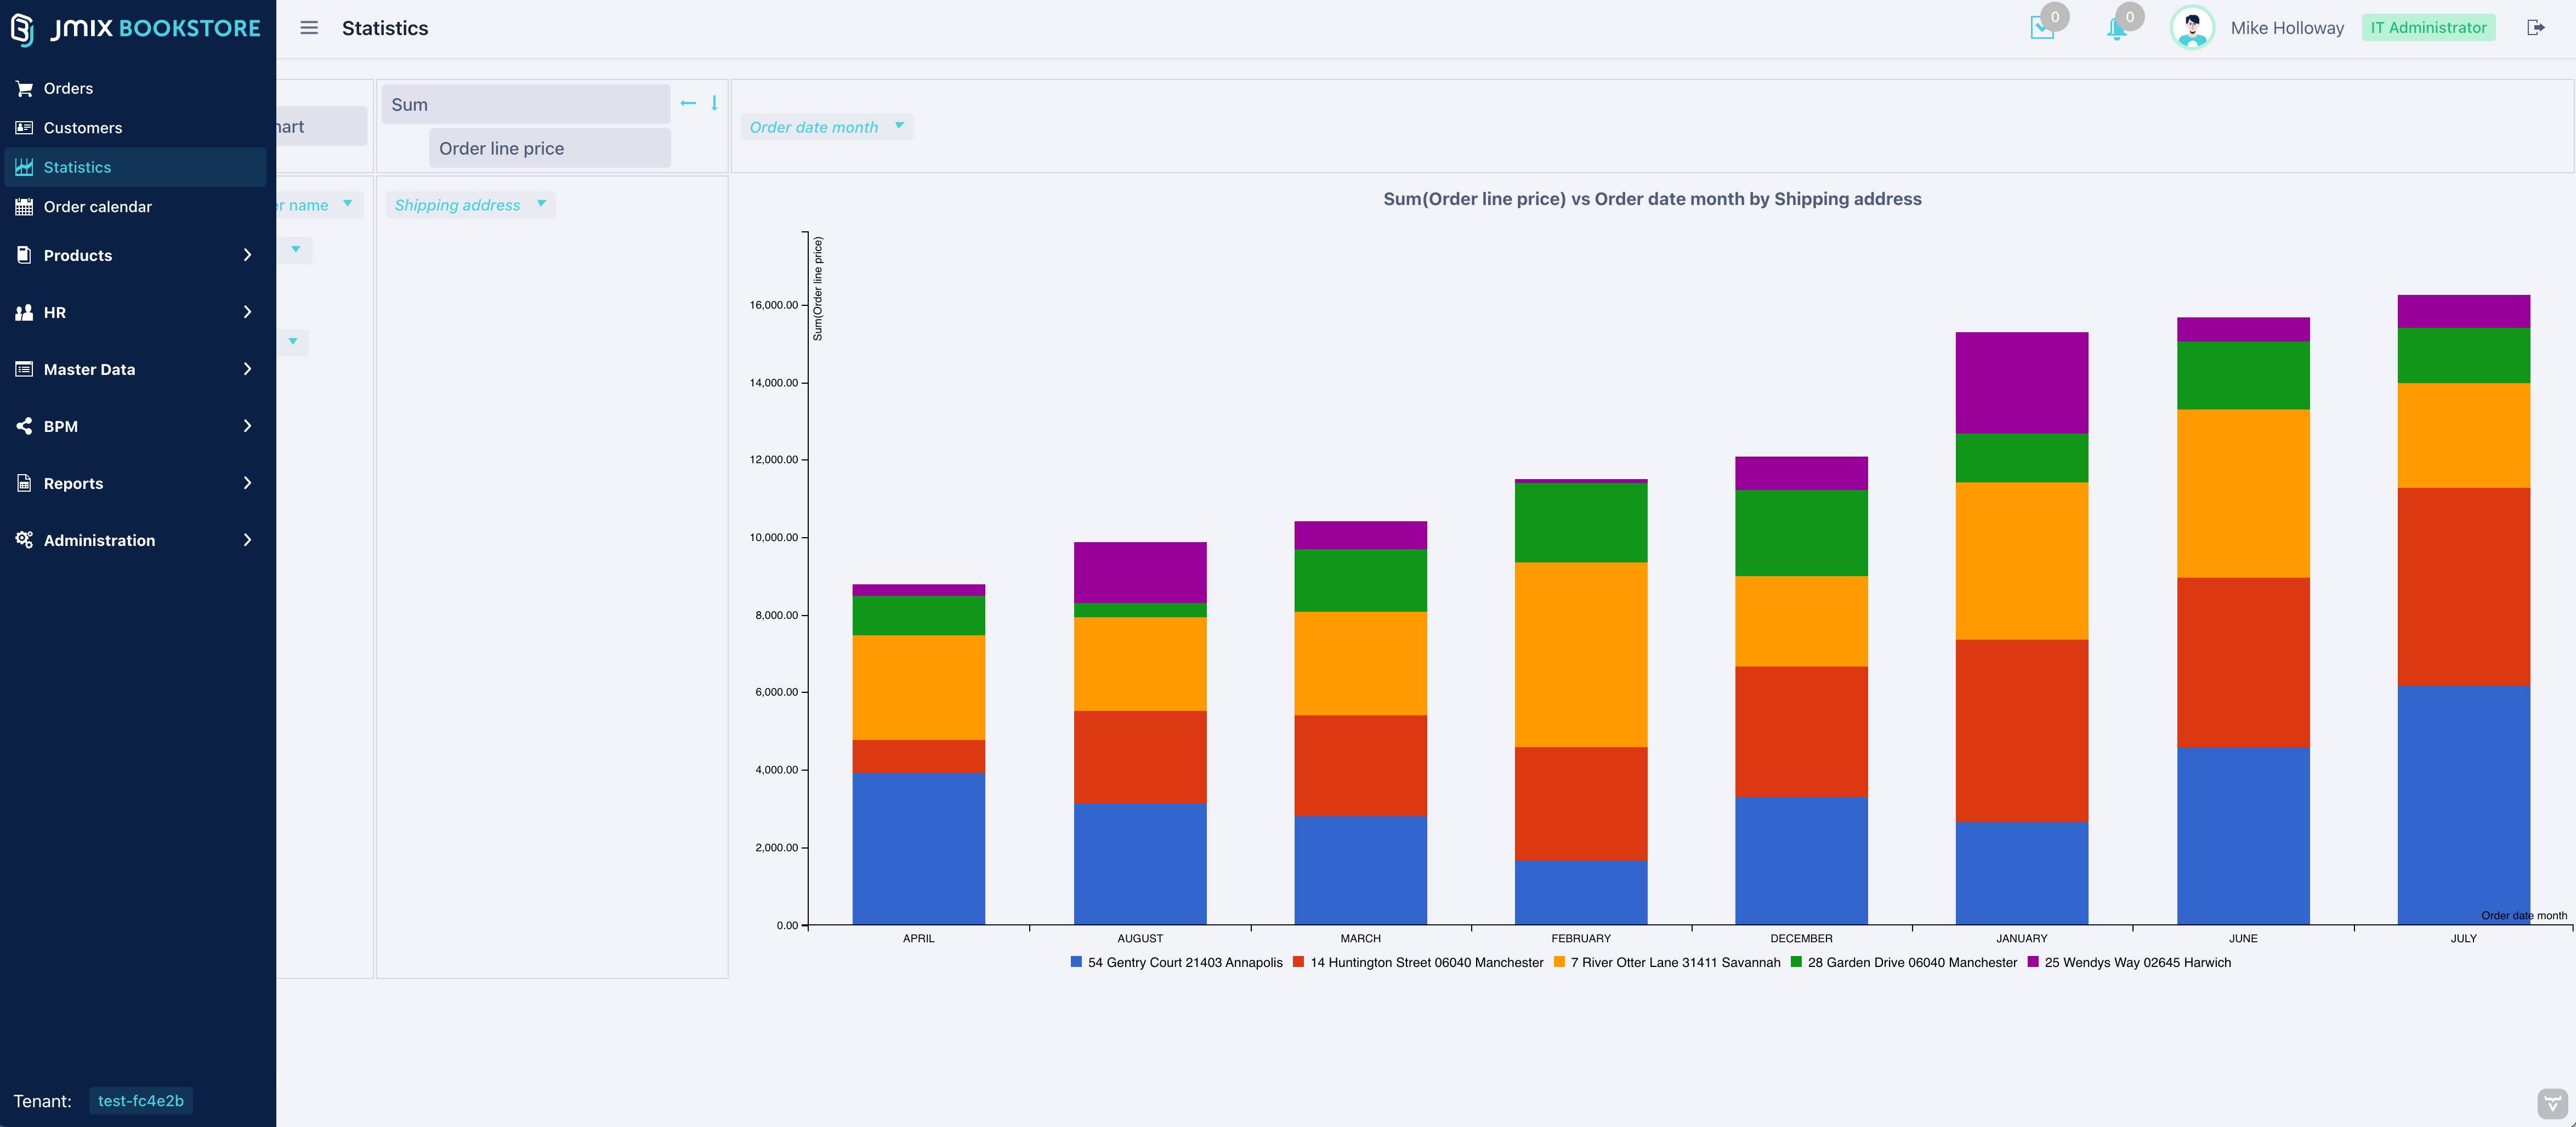
- Customizable renderers: Choose from a variety of built-in renderers—including tables, heatmaps, and various chart types.
- Derived properties and custom aggregations: Extend functionality by defining new attributes derived from existing data and applying custom aggregation functions.
- Event listeners: Enhance interactivity with listeners for cell clicks and refresh events to trigger custom actions or updates.
- Runtime configuration: Configure pivot table properties, renderers, and aggregations at runtime through an administrative UI.
- Built-in excel export: Export data from table renderers directly to Excel for offline analysis or reporting.


